Scenario
Meet John, 56, and his wife Janet, 54. John runs ABC Ltd, a company which provides high quality examples in many business settings. Janet is a civil servant.
They have 3 children: Jill, Jenny and Johnny. They will all have flown the nest by the time John is 62. At this time John and Janet plan to travel and spend more for six years. Following this they plan to downsize their house.
They have various investments in the stock market, including John’s pension, although Janet is lucky enough to have a final salary pension. They like to take a medium-high level of risk with their investments.
Assuming the economy and the stock market proceeds at a general average over the remaining period of their lives they will be in good shape, with no deficit at any stage.
Modelling a major loss
Once the media start focussing on other things it’s easy to forget that there is still a substantial chance that Greece or many others may drop out of the Euro, triggering a mechanism that will essentially send confidence back to levels seen earlier in the year, or worse. I won’t get into too much speculation on that because a major loss can come from anywhere when we least expect it.
So is your financial planning robust enough for a tornado to tear through Canary Wharf?
John and Janet would like to know, and we can help them run one of many scenarios.
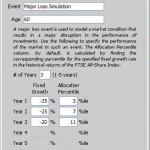
Let’s say our disaster event creates the following effect: a 3 year loss of -35%, -25% and -20%. This occurs when John is age 60 (in 4 years).
Each investment in the stock market that John and Janet have has been modelled as close to reality as possible in terms of asset allocation, and based on statistics from Novia Market Assumptions.
Each of these investments will be automatically affected by our loss simulation above.
So what do we find out?
Figure 1
Figure 2
In the cash flow chart we can see a period of red setting in from age 77, unlikely the status quo base plan chart from above.
The effect is more strongly seen in the liquid assets charts, with usable funds running out at age 76.
In the base plan the growth rate was 6-7%. Once we factor in that this major loss will occur, we see that 9.06% growth is required on these assets from the start of the plan, or 10.57% is required once the major loss has occurred, to ensure once again that there will be no shortfall.
So what does this mean? Well, for John and Janet, they would likely have to downsize again at age 77 to free up more liquid assets.
What would it mean for you?
Get in touch for a comprehensive look at your planning.
Malcolm Stewart

